Analysis Data Waveform and Orbit Theory
Header structure is the following:
- First register contains signature
- Second register contains type
- Third register contains data array size
- Fourth register contains data array CRC
- Fifth register contains groove array size
- Sixth register contains groove array CRC
- Seventh register is reserved
- Eight register contains CRC of the header
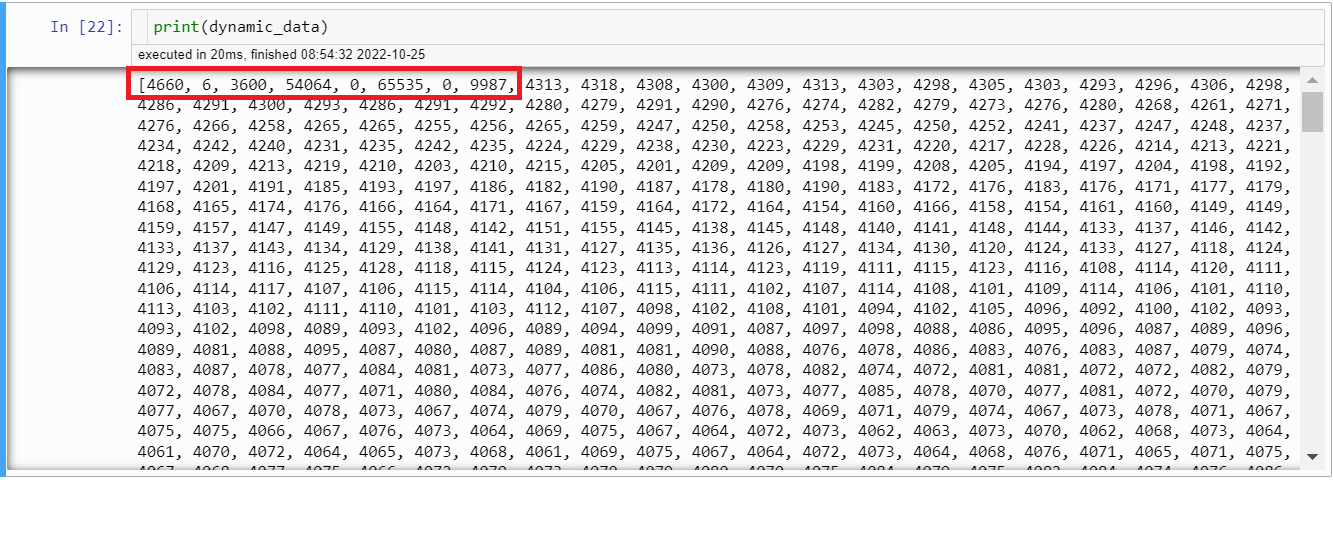
In your example:
4660 = 0x1234 is the correct signature
6 is type
3600 is the size of the data array
54064 is CRC of the 3600-sample data array
0 is the size of the groove indexes array (this indicates that you did not have any notches)
65535 is CRC of the groove array( which you do not need to calculate in your case because you did not have any notches)
0 is just a reserved member of header, we do not use it for now. We allocated it for later in case if we ever need to place something else in header.
9987 is crc of the header.
Orbit Plots: DataClipSamples.xlsx
Above is a computer-generated signal in excel.
I used it to check whether our ideas with notch functionality would work.
This describes the process of getting from two sinewaves to an orbit signal.
I replaced 1800 Ch A data clip samples with 1800 samples of perfect sin wave.
Likewise, 1800 Ch B data clip samples with 1800 samples of perfect cos wave.
The computer-generated signal created perfect looking orbit, so we could test our notch functionality.
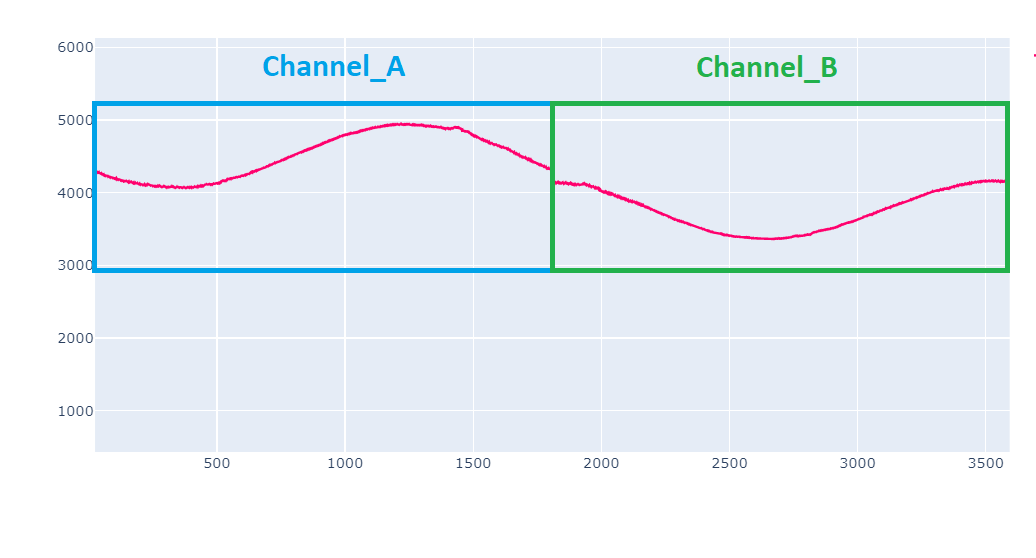
As for combining two data charts into orbit, you simply set MODBUS CHANNEL NUMBER REGISTER 40033 to MODBUS_CHANNELS_AB command.
This will capture data from both channels.
Data array size will be 3600 samples.
First 1800 samples are ch A samples.
Next 1800 samples are ch B samples.
So, it is easy to separate them.
Then you just plot channel A against channel B and you will get your orbit.
No Comments