Analysis Data (Time Waveform & Vibration Spectrum)
TriVibe supports raw data (analysis data used by Vibration Experts and Machine Learning Algorithms to identify component failures) export via Modbus Read/Write commands.
Machine Saver provides sample Python code to handle this entire process just scroll past this block diagram.
The registers in this document are 0-indexed, if you use a Modbus master that requires the first memory location to be a value of 1, you must add add 1 to each register. Example: the set capture time register when 0-indexed is 35, in a 1-indexed system it would be register 36.
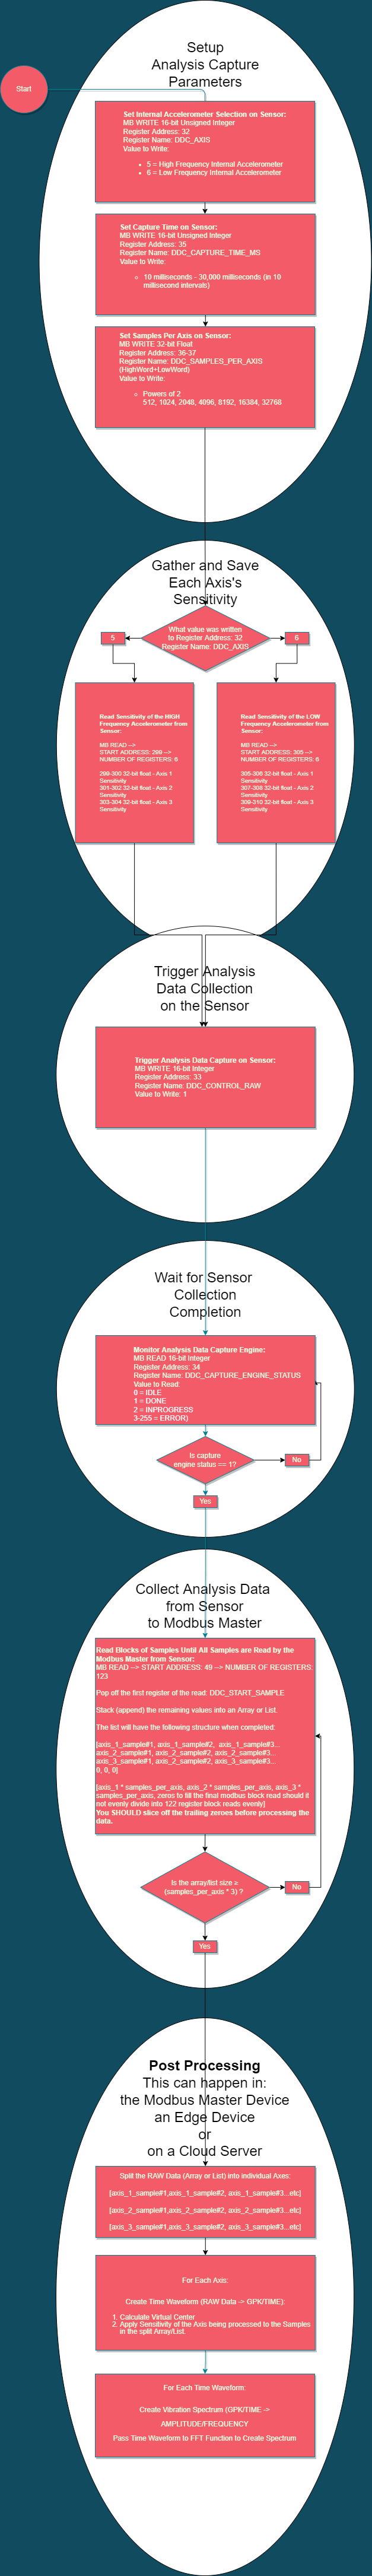
The Process in a Block Diagram
Sample Python Script which Handles the Entire Procedure Described Above
It also handles the following:
- Saving a minified JSON file of the timewave form which may be easily passed over MQTT or HTTP/HTTPS or your preferred data route to be processed elsewhere.
- It provides the Transform Function to move from the time domain to the frequency domain.
- It provides code to chart the data in format which has zoom and highlight features.
#!/usr/bin/env python
# coding: utf-8

# In[1]:


from datetime import datetime
import json, math, minimalmodbus
import numpy as np
import os
import plotly.graph_objects as go
from scipy.fftpack import fft
from scipy.integrate import cumtrapz
import serial.tools.list_ports
import time


# # Helper Functions

# In[2]:


def twf_x_axis(data):

    """ Using the samplerate and time of the analysis data capture this function will return an x-axis value
    (milliseconds passed since timestamp/capture trigger) for each corresponding y-axis value (amplitude of vibration (gPK))."""

    fs = data["samples_per_axis"]/(data["capture_time_ms"]/1000)
    twf_x = np.arange(0,data["capture_time_ms"]/1000,1/fs)
    return twf_x

def process_to_twf(data, axis):

    """ || RAW ADC Counts -> Acceleration TWF || Takes a single axis array/list of ADC counts from a TriAxial Accelerometer,
    arranges values above 0 as positive, below 0 as negative values and at the virtual center as 0.
    Scales the values by constant_k (3000mV/16-bits) and finally applies the sensitivity conversion factor
    to get Gs of acceleration."""

    if(axis==1):
        axis_raw=data["axis_1_RAW"]
        sensitivity=data["sensitivity_s1_a1"]
    elif(axis==2):
        axis_raw=data["axis_2_RAW"]
        sensitivity=data["sensitivity_s1_a2"]
    elif(axis==3):
        axis_raw=data["axis_3_RAW"]
        sensitivity=data["sensitivity_s1_a3"]
    elif(axis==4):
        axis_raw=data["axis_1_RAW"]
        sensitivity=data["sensitivity_s2_a1"]
    elif(axis==5):
        axis_raw=data["axis_2_RAW"]
        sensitivity=data["sensitivity_s2_a2"]
    elif(axis==6):
        axis_raw=data["axis_3_RAW"]
        sensitivity=data["sensitivity_s2_a3"]

    virtual_center = (max(axis_raw)-min(axis_raw))/2+min(axis_raw)
    constant_k = 3000/65535
    axis_twf = axis_raw.copy()
    for position in range(len(axis_twf)):
        if axis_twf[position]>virtual_center:
            axis_twf[position] = (abs(axis_twf[position] - virtual_center)*constant_k)/sensitivity
        elif axis_twf[position]<virtual_center:
            axis_twf[position] = (-abs(axis_twf[position] - virtual_center)*constant_k)/sensitivity
        else:
            axis_twf[position] = 0
    return(axis_twf)

def spectrum_x_axis(data):

    """ Using the samplerate and capture time of the analysis data this function will return an x-axis value
    (frequency bins of vibration energy) for each corresponding y-axis value of a spectrum plot (amplitude of vibration (gPK))."""

    fs = data["samples_per_axis"]/(data["capture_time_ms"]/1000)
    twf_x = np.arange(0,data["capture_time_ms"]/1000,1/fs)
    n = np.size(twf_x)
    fbin = (fs/2)*np.linspace(0,1,n//2)
    return fbin

def process_to_spectrum(data, axis):

    """ || Acceleration TWF -> Acceleration Spectrum || Converts acceleration (gPK) in the time domain to acceleration (gPK) frequency domain."""

    if(axis==1):
        axis_twf=data["axis_1_TWF"]
    elif(axis==2):
        axis_twf=data["axis_2_TWF"]
    elif(axis==3):
        axis_twf=data["axis_3_TWF"]
    elif(axis==4):
        axis_twf=data["axis_4_TWF"]
    elif(axis==5):
        axis_twf=data["axis_5_TWF"]
    elif(axis==6):
        axis_twf=data["axis_6_TWF"]

    fs = data["samples_per_axis"]/(data["capture_time_ms"]/1000)
    twf_x = np.arange(0,data["capture_time_ms"]/1000,1/fs)
    n = np.size(twf_x)
    fbin = (fs/2)*np.linspace(0,1,n//2)
    y = fft(axis_twf)
    y_normalized = (2/n)*abs(y[0:np.size(fbin)])
    return y_normalized.tolist()

def acc_to_vel_spectrum(data, dictionary)
	acc_spectrum = data
    fs = data["samples_per_axis"]/(data["capture_time_ms"]/1000)
    dt = 1/fs
    time = np.arange(0, data["capture_time_ms"]/1000, dt)
    velocity = cumtrapz(acc_spectrum, time, initial=0)
    return velocity

def save_clip_json(dictionary):

    """Takes a python dictionary of unprocessed analysis data, turns it into a serialized JSON
    and saves it to a file with the associated sensor serial number and the timestamp of the collection.
    Data size (assuming a minified JSON file --- no spaces) for 49,152 samples (16,384 samples_per_axis * 3 axes) is 289kB.
    Therefore, using 1GB of storage could store upto 3460 data clips with this number of samples."""

    encoded_json=json.JSONEncoder().encode(dictionary)
    file_name = str(dictionary["serial_number"])+"_"+str(dictionary["unix_timestamp"])+".json"
    f = open(file_name, "w")
    f.write(encoded_json)
    f.close()
    return(None)


# # Port Finder

# In[3]:


ports = list(serial.tools.list_ports.comports())
if len(ports)==0:
    print('Please connect a USB to RS485 serial converter into PC.')
else:
    for p in ports:
        print (p)


# # Slave Setup

# In[4]:


trivibe=minimalmodbus.Instrument(port='COM3', slaveaddress=64)

# update current slave settings for Tri-Vibe defaults and some useful variables
trivibe.serial.port                        # this is the serial port name
trivibe.address                            # this is the slave address (set this to the last 2 digits of the serial number of the Tri-Vibe that you want to communicate with)
trivibe.serial.baudrate = 115200           # Baudrate fixed 115200
trivibe.serial.bytesize = 8                # Bytesize fixed 8
trivibe.serial.parity   = "N"              # Parity fixed None
trivibe.serial.stopbits = 1                # Stopbits fixed 1
trivibe.serial.timeout  = 0.10             # Seconds
trivibe.close_port_after_each_call = True  # Helps communication for Windows Devices (can be set to false on many Linux devices)
trivibe.mode = minimalmodbus.MODE_RTU      # modbus mode fixed RTU Mode
trivibe.clear_buffers_before_each_transaction = True

print(trivibe)                             # check updated slave communication settings


# # Local Dictionary for Analysis Data Storage (JSON)

# In[5]:


# example_json = {
#     "serial_number": 21030569,
#     "sensitivity_s1_a1": 66.74067687988281,
#     "sensitivity_s1_a2": 67.11312103271484,
#     "sensitivity_s1_a3": 66.40936279296875,
#     "sensitivity_s2_a1": 331.8104553222656,
#     "sensitivity_s2_a2": 331.3285217285156,
#     "sensitivity_s2_a3": 329.0369873046875,
#     "internal_accelerometer": 5,
#     "capture_time_ms": 1000,
#     "samples_per_axis": 5,
#     "unix_timestamp": 1644420691,
#     "axis_1_raw":[32768,32785,32792,32765,32755],
#     "axis_2_raw":[32770,32762,32760,32775,32780],
#     "axis_3_raw":[32755,32762,32768,32771,32759]
# }

# A simple container to hold important processing information for an analysis clip
# Use the helper function "save_clip_json(dictionary)" to write the dictionary file to your PC after collecting a data clip.

data = {}


# # Serial Number

# In[6]:


data["serial_number"] = trivibe.read_long(26, functioncode=3)
print(data["serial_number"])


# # Revision

# In[7]:


sensor_revision = trivibe.read_register(0, functioncode=3)
print('Sensor Software Revision:', sensor_revision-768)


# # Error

# In[8]:


error = trivibe.read_register(4, functioncode=3)
print(error)


# # Uptime

# In[9]:


sensor_uptime = trivibe.read_registers(5, 3, functioncode=3)
print('Days:', str(sensor_uptime[2]),', Hours:',str(sensor_uptime[1]),', Minutes:',str(sensor_uptime[0]))


# # Set Sensitivity

# In[10]:


# trivibe.write_register(1, 24576)
# trivibe.write_float(299, 500.0, number_of_registers=2)
# trivibe.write_float(301, 500.0, number_of_registers=2)
# trivibe.write_float(303, 500.0, number_of_registers=2)
# trivibe.write_float(305, 500.0, number_of_registers=2)
# trivibe.write_float(307, 500.0, number_of_registers=2)
# trivibe.write_float(309, 500.0, number_of_registers=2)
# trivibe.write_register(1, 24577)


# # Sensitivity

# In[11]:


data["sensitivity_s1_a1"] = trivibe.read_float(299, functioncode=3, number_of_registers=2, byteorder=0)
data["sensitivity_s1_a2"] = trivibe.read_float(301, functioncode=3, number_of_registers=2, byteorder=0)
data["sensitivity_s1_a3"] = trivibe.read_float(303, functioncode=3, number_of_registers=2, byteorder=0)
data["sensitivity_s2_a1"] = trivibe.read_float(305, functioncode=3, number_of_registers=2, byteorder=0)
data["sensitivity_s2_a2"] = trivibe.read_float(307, functioncode=3, number_of_registers=2, byteorder=0)
data["sensitivity_s2_a3"] = trivibe.read_float(309, functioncode=3, number_of_registers=2, byteorder=0)

print(data)


# # Overall - Filters

# In[12]:


trivibe=trivibe.read_register(375, functioncode=3)
print("LowPass", trivibe/10, "Hz")
trivibe=trivibe.read_register(376, functioncode=3)
print("HighPass", trivibe/10, "Hz")


# # Overall - Acceleration

# In[13]:


trivibe=trivibe.read_float(190, functioncode=3)
print("S1_A1_Accel", trivibe)
trivibe=trivibe.read_float(192, functioncode=3)
print("S1_A2_Accel", trivibe)
trivibe=trivibe.read_float(194, functioncode=3)
print("S1_A3_Accel", trivibe)
trivibe=trivibe.read_float(208, functioncode=3)
print("S2_A1_Accel", trivibe)
trivibe=trivibe.read_float(210, functioncode=3)
print("S2_A2_Accel", trivibe)
trivibe=trivibe.read_float(212, functioncode=3)
print("S2_A3_Accel", trivibe)


# # Overall - Velocity

# In[14]:


trivibe=trivibe.read_float(196, functioncode=3)
print("S1_A1_Vel", trivibe)
trivibe=trivibe.read_float(198, functioncode=3)
print("S1_A2_Vel", trivibe)
trivibe=trivibe.read_float(200, functioncode=3)
print("S1_A3_Vel", trivibe)
trivibe=trivibe.read_float(214, functioncode=3)
print("S2_A1_Vel", trivibe)
trivibe=trivibe.read_float(216, functioncode=3)
print("S2_A2_Vel", trivibe)
trivibe=trivibe.read_float(218, functioncode=3)
print("S2_A3_Vel", trivibe)


# # Set Capture Parameters

# In[15]:


# High Frequency Accelerometer = 5
accelerometer = 5
trivibe.write_register(32, accelerometer)

capture_time_ms=1000
trivibe.write_register(35, capture_time_ms)

samples_per_axis=16384
trivibe.write_long(36, samples_per_axis, signed=False, byteorder=0)

data["internal_accelerometer"] = trivibe.read_register(32, functioncode=3)
data["capture_time_ms"] = trivibe.read_register(35, functioncode=3)
data["samples_per_axis"] = trivibe.read_long(36, functioncode=3)

print(data)


# # Trigger Capture + Timestamp

# In[16]:


trivibe.write_register(33, 1)
data["unix_timestamp"] = int(str(time.time())[slice(10)])
snapshotTime = datetime.fromtimestamp(data["unix_timestamp"])
print(data)


# # Check Capture Status on Sensor

# In[17]:


capture_engine_status = trivibe.read_register(34, functioncode=3)
print('capture_engine_status: '+str(capture_engine_status))

# wait for data capture on the Tri-Vibe to complete
while capture_engine_status==2:
    capture_engine_status = trivibe.read_register(34, functioncode=3)
    print('capture_engine_status: '+str(capture_engine_status))
    time.sleep(2)

# show capture engine is complete (capturing done)
capture_engine_status = trivibe.read_register(34, functioncode=3)
print('capture_engine_status: '+str(capture_engine_status))


# # Collect RAW ADC Data from Sensor

# In[18]:


twf_x = twf_x_axis(data)


# In[19]:


triaxial_raw =[]
while len(triaxial_raw)<data["samples_per_axis"]*3:
    read_set = trivibe.read_registers(49, 123, functioncode=3)
    read_set.pop(0)
    triaxial_raw.extend(read_set)

# unless samples/axis*3 is evenly divisable by 122, this slices off the erroneous zeros that are tacked to the last reading of the 122 data registers...
triaxial_raw = triaxial_raw[0:data["samples_per_axis"]*3]

data['axis_1_RAW'] = triaxial_raw[0:data["samples_per_axis"]]
data['axis_2_RAW'] = triaxial_raw[data["samples_per_axis"]:data["samples_per_axis"]*2]
data['axis_3_RAW'] = triaxial_raw[data["samples_per_axis"]*2:data["samples_per_axis"]*3]


# # Save Raw Data into JSON File

# In[20]:


save_clip_json(data)


# In[21]:


fig = go.Figure()
fig.add_trace(
    go.Scatter(
        x=twf_x,
        y=data['axis_1_RAW'],
        mode="lines",
        line=go.scatter.Line(color="#FF006D"),
        showlegend=True,
        name="Axis 1 RAW")
)

fig.add_trace(
    go.Scatter(
        x=twf_x,
        y=data['axis_2_RAW'],
        mode="lines",
        line=go.scatter.Line(color="#FFDD00"),
        showlegend=True,
        name="Axis 2 RAW")
)

fig.add_trace(
    go.Scatter(
        x=twf_x,
        y=data['axis_3_RAW'],
        mode="lines",
        line=go.scatter.Line(color="#01BEFE"),
        showlegend=True,
        name="Axis 3 RAW")
)

fig.show()


# # Process + Plot Timewave Form

# In[22]:


data["axis_1_TWF"]=process_to_twf(data, 1)
data["axis_2_TWF"]=process_to_twf(data, 2)
data["axis_3_TWF"]=process_to_twf(data, 3)


# In[23]:


fig = go.Figure()
fig.add_trace(
    go.Scatter(
        x=twf_x,
        y=data["axis_1_TWF"],
        mode="lines",
        line=go.scatter.Line(color="#FF006D"),
        showlegend=True,
        name="Axis 1 TWF")
)

fig.add_trace(
    go.Scatter(
        x=twf_x,
        y=data["axis_2_TWF"],
        mode="lines",
        line=go.scatter.Line(color="#FFDD00"),
        showlegend=True,
        name="Axis 2 TWF")
)

fig.add_trace(
    go.Scatter(
        x=twf_x,
        y=data["axis_3_TWF"],
        mode="lines",
        line=go.scatter.Line(color="#01BEFE"),
        showlegend=True,
        name="Axis 3 TWF")
)

fig.show()


# # Process + Plot Spectrum Form

# In[24]:


spectrum_x = spectrum_x_axis(data)

data["axis_1_SPEC"]=process_to_spectrum(data, 1)
data["axis_2_SPEC"]=process_to_spectrum(data, 2)
data["axis_3_SPEC"]=process_to_spectrum(data, 3)


# In[25]:


save_clip_json(data)


# In[27]:


fig = go.Figure()
fig.add_trace(
    go.Scatter(
        x=spectrum_x,
        y=data["axis_1_SPEC"],
        mode="lines",
        line=go.scatter.Line(color="#FF006D"),
        showlegend=True,
        name="Axis 1 Spectrum")
)

fig.add_trace(
    go.Scatter(
        x=spectrum_x,
        y=data["axis_2_SPEC"],
        mode="lines",
        line=go.scatter.Line(color="#FFDD00"),
        showlegend=True,
        name="Axis 2 Spectrum")
)

fig.add_trace(
    go.Scatter(
        x=spectrum_x,
        y=data["axis_3_SPEC"],
        mode="lines",
        line=go.scatter.Line(color="#01BEFE"),
        showlegend=True,
        name="Axis 3 Spectrum")
)

fig.show()


# # Low-Frequency - Data Capture

# In[28]:


# LowFrequency Accelerometer = 6
accelerometer = 6
trivibe.write_register(32, accelerometer)

capture_time_ms=1000
trivibe.write_register(35, capture_time_ms)

samples_per_axis=16384
trivibe.write_long(36, samples_per_axis, signed=False, byteorder=0)


# In[29]:


# Trigger Sensor to Start Collecting
trivibe.write_register(33, 1)

# Metadata to be used when displaying our charts to users, Removes the portion of the timestamp beyond seconds
timestamp = int(str(time.time())[slice(10)])

# Human Readable Timestamp Format
snapshotTime = datetime.fromtimestamp(timestamp)


# In[30]:


capture_engine_status = trivibe.read_register(34, functioncode=3)
print('capture_engine_status: '+str(capture_engine_status))

# wait for data capture on the Tri-Vibe to complete
while capture_engine_status==2:
    capture_engine_status = trivibe.read_register(34, functioncode=3)
    print('capture_engine_status: '+str(capture_engine_status))
    time.sleep(2)

# show capture engine is complete (capturing done)
capture_engine_status = trivibe.read_register(34, functioncode=3)
print('capture_engine_status: '+str(capture_engine_status))
No Comments